San Clemente

City Market · City Intelligence Published · Orange County, CA

You can't really understand San Clemente through a single citywide median price. The residential market runs from historic coastal streets and custom beach neighborhoods out to hillside view communities, established suburban tracts, and large master-planned developments like Forster Ranch and Talega. This guide breaks down how all those pieces fit together.

An eight-module guided path through the San Clemente research, for agents learning the market rather than looking something up.

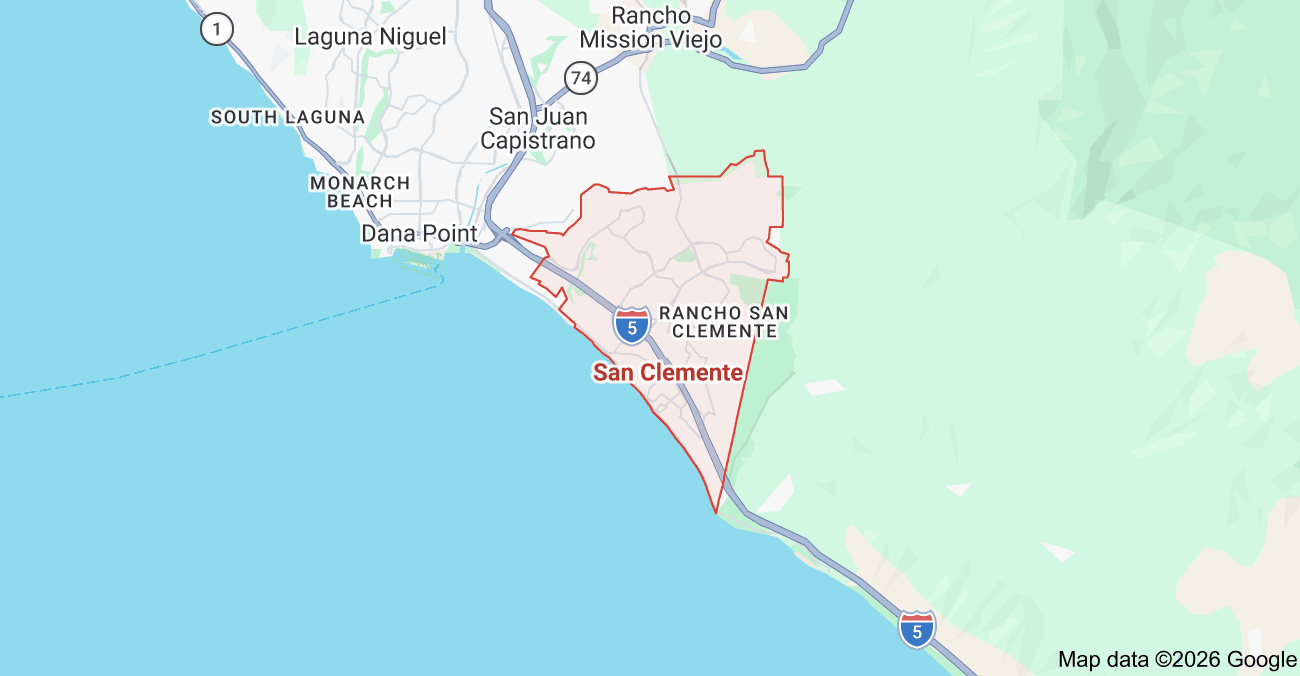
Orientation map showing San Clemente within South Orange County, California
San Clemente orientation map. For geographic orientation only. Do not rely on this image as an official municipal, market, subdivision, parcel or association boundary.

Open in Visual AtlasCompare This MarketClient Prep

Durable research last reviewed September 1, 2026

Market Brief

San Clemente in Brief

Market Identity

The southern edge of Orange County, where the coastline, Interstate 5, and a series of ridges and canyons do most of the work dividing the housing market.

Housing Snapshot

Spanish Colonial Revival originals in the coastal grid, 1950s-70s tract homes, 1980s-90s hillside production builds in Rancho San Clemente, Forster Ranch, and Marblehead, 2000s master-planned Talega, and modern coastal infill and rebuilds.

Common Alternatives

  • Dana Point
  • San Juan Capistrano
  • Laguna Niguel
  • Rancho Mission Viejo

Key Value Drivers

  • Coastal side versus inland side of Interstate 5
  • View type and whether that specific view is protected
  • Construction era, which dictates systems, materials, and renovation history
  • Association structure, from no HOA at all to a master plus sub-association and a Mello-Roos special tax district
  • Lot condition: slope, pad, usable yard, and driveway access
  • Named beach access, walking routes, and rail-corridor crossings

Important Watchouts

  • Southwest San Clemente, Pier Bowl, T-Street, Riviera, and Marblehead Coastal are everyday terms, but they don't map cleanly onto recorded subdivisions.
  • You can lose a view to buildout, landscaping, or a neighbor's remodel. Whether that view is protected comes down to the recorded documents and local regulations.
  • The rail corridor sits between much of the coastal housing and the sand, and exposure varies block by block.
  • Coastal salt air changes the maintenance cycle for windows, doors, hardware, and exterior finishes.
  • Talega's 44 named subdivisions are easy to mix up. Always confirm the recorded tract before pulling comps.
  • This platform doesn't publish dues amounts or tax rates because they differ between neighboring tracts and go stale.

Structured intelligence last reviewed September 2, 2026. Derived from the durable San Clemente research on this page. Association scope, special taxes and view protection are property-specific and must be verified from current documents.

Quick Intelligence

San Clemente Market Intelligence

A structured summary of the durable research below. The lens narrows this summary only. The full research sections on this page are always available.

Buyer Fit

Beach proximity versus house

Buyer

The same budget gets you either a smaller, older home near the sand or a newer, larger home inland.

  • Almost every San Clemente search comes down to some version of this decision
  • Older coastal neighborhoods often have no association and no amenities
  • Master-planned areas carry a monthly cost in exchange for pools, parks, and trails
Go deeper

View premium versus view risk

Buyer

White water, blue water, peek ocean, canyon, hillside, and ridge views are each their own market.

  • Check what's protected and what isn't before you pay for it
  • Buildout, landscaping, and a neighbor's remodel can all change a view
  • Protection comes down to the tract, the association documents, and city regulation
Go deeper

Watchouts

The rail corridor and coastal exposure

On the coastal side, what sits between two properties matters more than the distance between them.

  • The tracks sit between a lot of the housing and the sand
  • Access, noise, and crossing points vary block by block
  • Visit at more than one time of day
  • Salt air speeds up wear on windows, doors, hardware, and finishes
Go deeper

Competitive Set

Talega is a market inside the market

Talega offers a mix of attached condominiums, detached production homes, executive properties, age-qualified housing, and golf-adjacent locations.

  • Layered master, sub-association, and special tax obligations differ by tract
  • Fairway frontage, a course view, and proximity are three distinct positions
  • Amenity access is determined by the governing documents, not by geography
  • Confirm the exact recorded tract before you draw comparisons
Go deeper

Seller Positioning

Specific beats general

Seller

Two homes 400 feet apart can sit on opposite sides of a ridge, a canyon, an arterial, or the rail corridor.

  • Name the exact view type
  • Name the walking route to a named beach access
  • Document the lot condition and the scope of past permitted work
  • State the actual carrying-cost structure
Go deeper

Agent Talking Points

Terminology overlaps the map

Agent Study

The area names people use every day don't map cleanly onto recorded subdivisions.

  • Southwest San Clemente, Pier Bowl, T-Street, Riviera, and Marblehead Coastal are market terms.
  • Knowing which term a listing is using is part of reading the market.
  • The nine market-study groupings on this page are research units, not official districts.
Go deeper

Key Questions

  1. 01

    Is this property coastal side or inland side of I-5?

    The freeway is the most useful dividing line in town, separating pricing driven by proximity and access from newer homes, larger floor plans, and association structure.

    Go deeper
  2. 02

    Is the view protected?

    That depends on the tract, the association documents, and applicable city regulations. It's something you should verify rather than assume.

    Go deeper
  3. 03

    What is the walking route to the beach, and does it cross the rail corridor?

    Different access points serve different sets of streets, and whether the route crosses the tracks is a real distinction a map radius won't show.

    Go deeper
  4. 04

    What association and special tax obligations apply?

    Some neighborhoods have none. Others carry a master association, a sub-association, and special tax districts stacked together. It's a per-tract question.

    Go deeper
  5. 05

    What is the plumbing, sewer and roof history?

    Homes built from the 1960s through the early 1990s may still have original supply lines, and coastal exposure changes roof and exterior replacement timelines.

    Go deeper
  6. 06

    Was prior work permitted?

    Beach neighborhoods have decades of remodels, additions, and conversions. Unpermitted work impacts property value, insurability, and future resale.

    Go deeper

San Clemente Orientation

San Clemente sits at the southern edge of Orange County, where the coastline, Interstate 5, and a series of inland ridges and canyons do most of the work dividing the housing market.

Three orientation details explain most of the map. First, Interstate 5 runs roughly parallel to the coast and serves as the practical dividing line between beach-oriented neighborhoods and inland hillside or master-planned developments. Second, El Camino Real is the historic north-south spine through town, while Avenida Pico, Avenida Vista Hermosa, and Avenida Palizada are the primary east-west connectors between the freeway, inland communities, and the coast. Third, elevation and orientation matter more here than in most South County cities. San Clemente is built across hillsides and canyons, so two houses on the same street can have completely different views, privacy, and yard usability.

Development also moves outward over time. In broad terms, the closer a neighborhood sits to the original coastal grid, the older it is. The further inland and uphill you go, the newer the homes tend to be. Talega, at the northeastern edge of the city, is the most recent large-scale expansion.

Explore San Clemente by Market Area & Subdivision

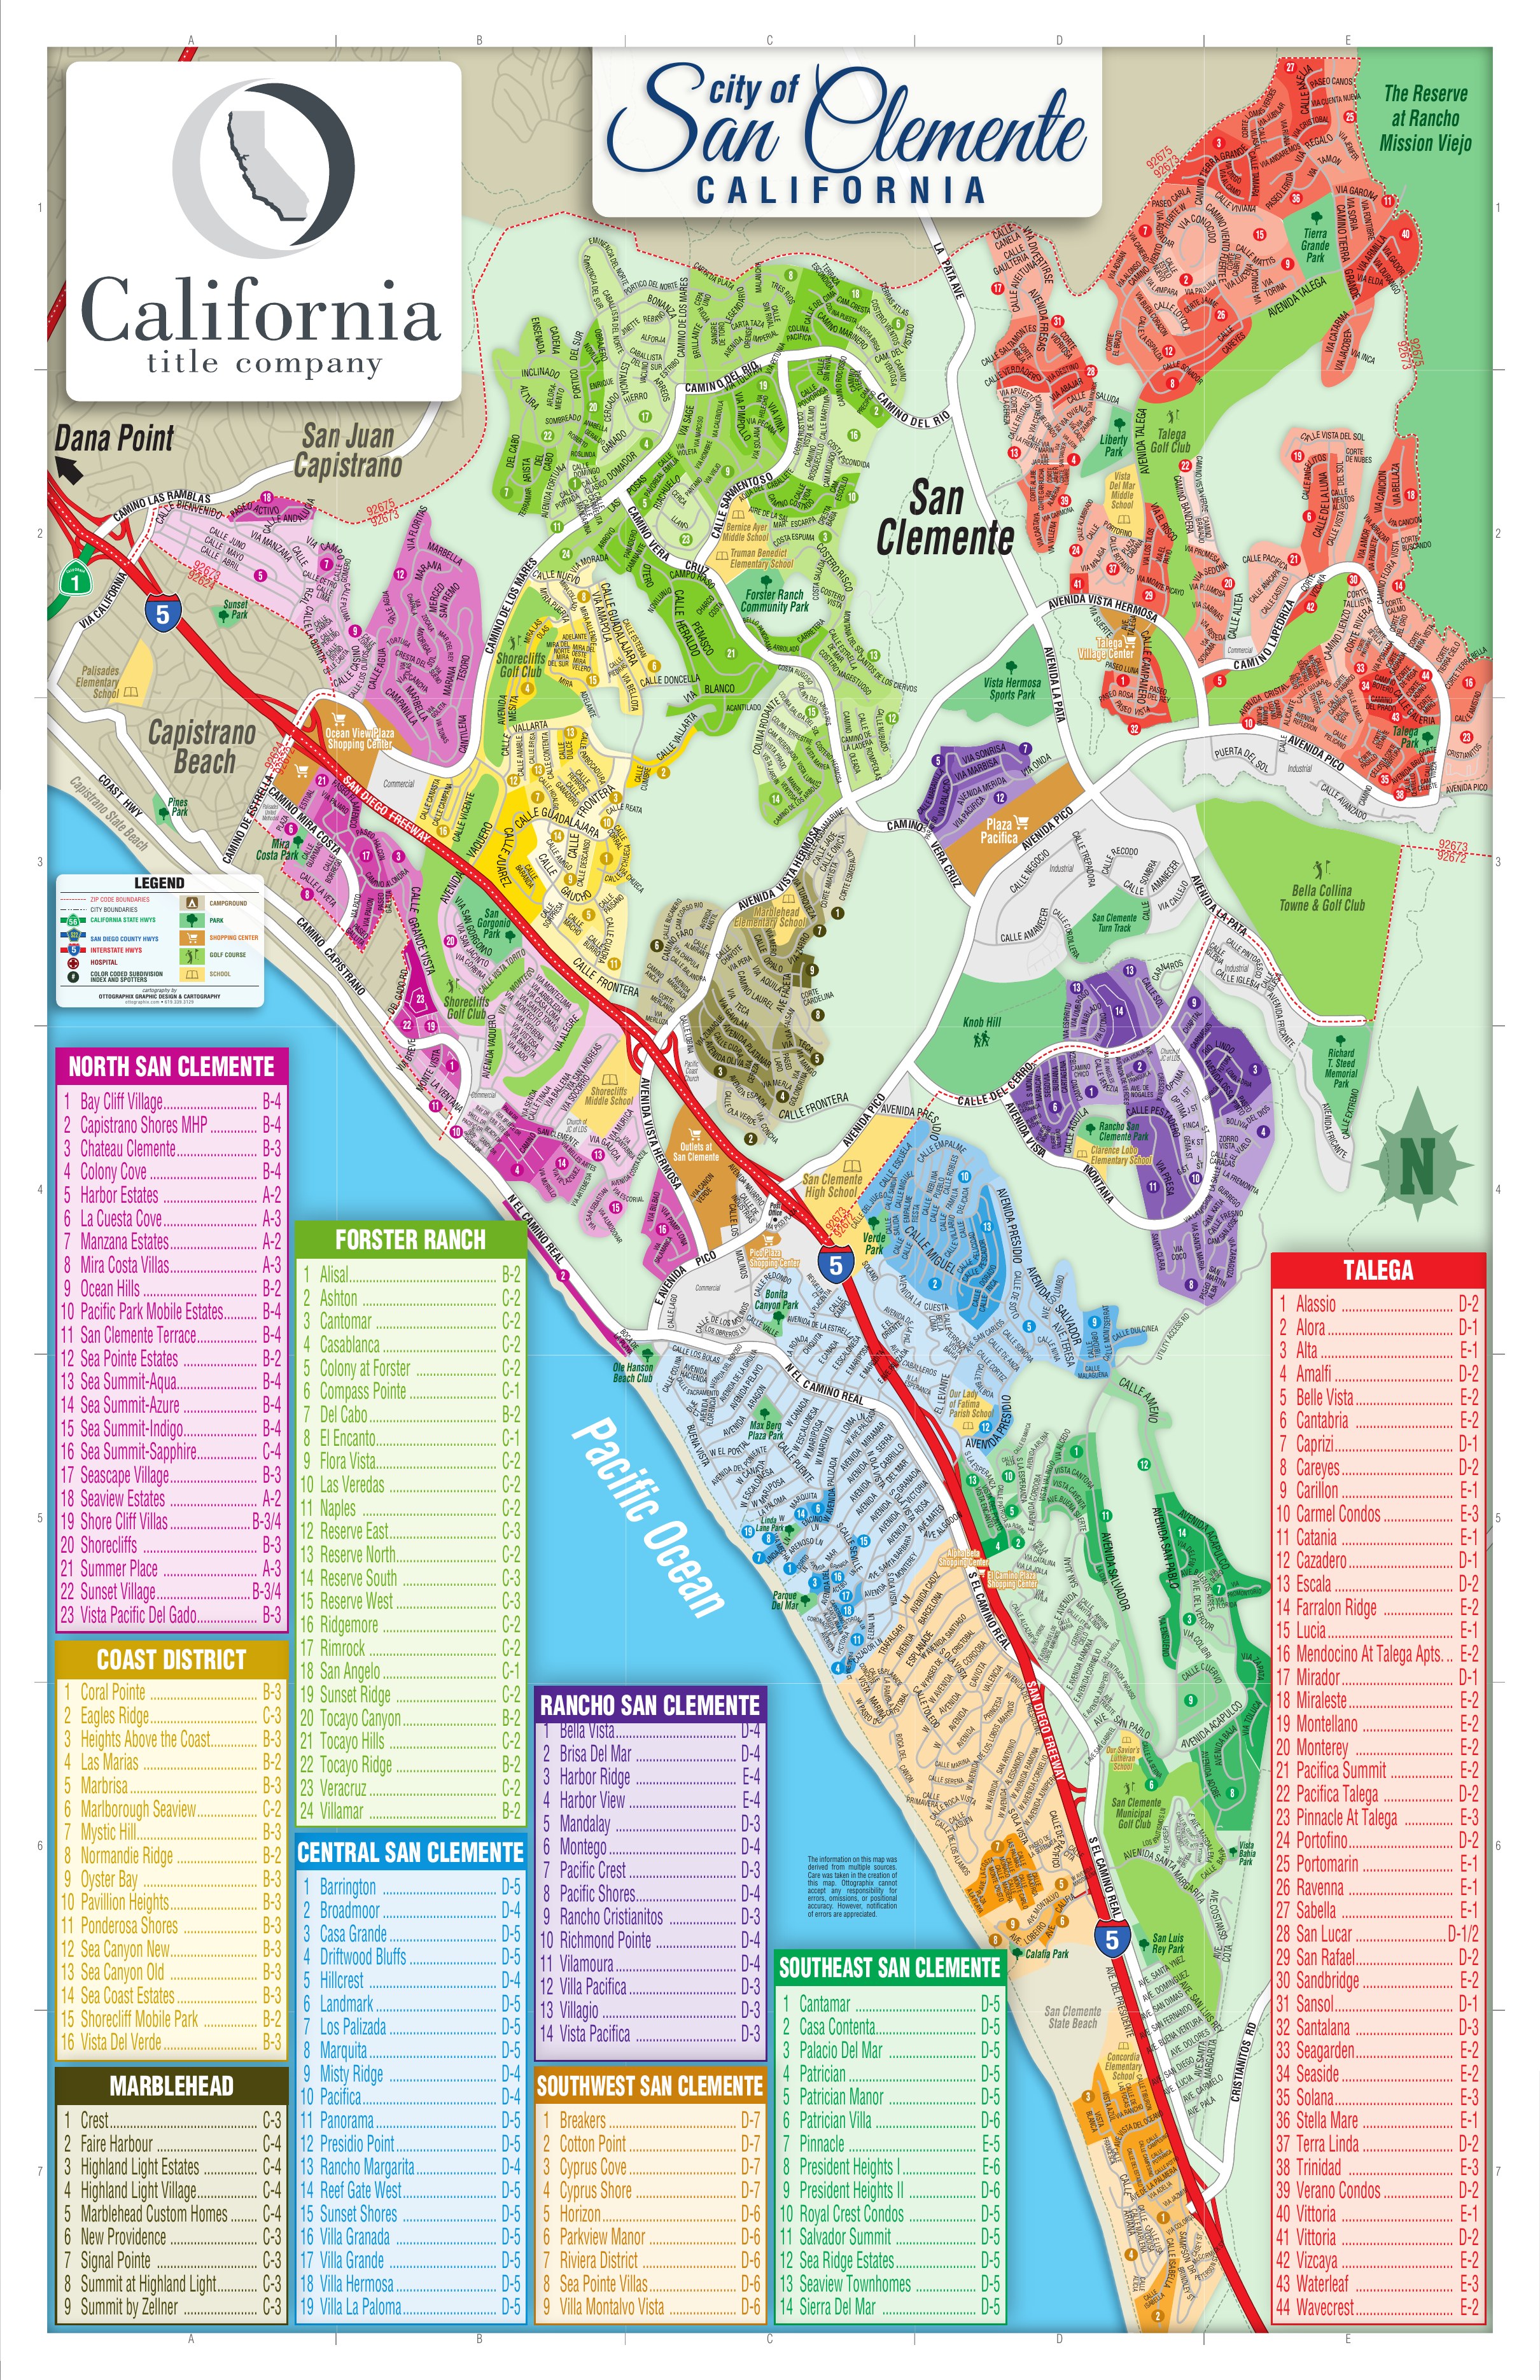
Color-coded map of San Clemente, California showing nine major market areas and their subdivision names

Pinch, scroll or use the controls to zoom. Drag to pan.

San Clemente color-coded subdivision map used as the geographic scaffold for this research. Market-area and subdivision terminology will continue to be verified and refined as the database develops.

This color-coded subdivision map is the geographic scaffold for the research on this page. Groupings shown on the map are cartographic conventions, not official city districts, and local real estate terminology does not always match them. Where the two diverge, this platform records both rather than picking one.

How to Read the San Clemente Market

A citywide median price doesn't tell you much here. These are the variables that actually separate one San Clemente property from another.

Coastal side versus inland side

Interstate 5

The freeway is the single most useful mental divider in town. West of I-5 the market is driven by proximity, walkability and ocean access; east of I-5 it is driven by newer product, larger floor plans, planned amenities and association structure.

View is a spectrum, not a checkbox

Elevation & orientation

White water, blue water, peek ocean, canyon, hillside and ridge views are each a different market. A view can also be lost to buildout, landscaping or a neighbor's remodel, so verify what is protected and what is not.

Era determines the building, not the address

Construction era

1920s-30s Spanish Village originals, 1960s-70s tract housing, 1980s-90s hillside development and 2000s+ master-planned construction each carry distinct systems, materials and renovation histories.

Association structure is layered

HOA & special taxes

Some neighborhoods have no association at all. Others carry a master association, a sub-association and special tax districts stacked together. This is a per-tract question, never a citywide one.

Lot condition is a real variable

Slope, pad, access

Hillside development produces slope lots, tandem and stacked driveways, retaining walls and small usable yards next to homes with flat, private pads. Two identical floor plans can trade very differently on lot alone.

Terminology overlaps

Naming

Southwest San Clemente, the Pier Bowl, T-Street, Riviera and Marblehead Coastal are terms in daily use that do not map cleanly onto recorded subdivisions. Knowing which term a listing is using is part of reading the market.

How San Clemente Was Built

  1. 1925 - 1930s

    Ole Hanson's Spanish Village by the Sea

    San Clemente is founded as a planned coastal town with an enforced Spanish Colonial Revival architectural identity. The original grid, the Pier, the Beach Club and several civic landmarks date to this period, and the architectural language still shapes design expectations citywide.

  2. 1940s - 1950s

    Slow growth and a military neighbor

    Growth stays modest through the war years and the decade after. The establishment of Camp Pendleton to the south permanently caps the city's southern expansion and shapes both its demographics and its housing demand.

  3. 1960s - 1970s

    Freeway-era suburban tracts

    Interstate 5 and regional growth push development outward from the original grid. Central and southeastern neighborhoods fill in with conventional tract housing, and the first significant condominium and attached communities appear.

  4. 1980s - 1990s

    Hillside and master-planned expansion

    Development climbs inland. Rancho San Clemente, Forster Ranch and the Marblehead-area subdivisions bring ridge and canyon housing, planned amenities and formal association structures to a market that previously had few.

  5. 2000s

    Talega

    The northeastern Talega development adds a large, layered master-planned community with its own golf course, village structure, mixed product types and special tax districts — effectively a second housing market inside the city.

  6. 2010s - present

    Coastal infill and Sea Summit

    With little raw land left, growth turns to coastal infill, teardown-and-rebuild activity in the older beach neighborhoods, and the Sea Summit development on the former Marblehead Coastal property west of I-5.

Working Market Areas

These nine groupings follow the color-coded subdivision map. They're used here as market-study units, not as official city districts or neighborhood boundaries, so comparable housing can be studied together.

North San Clemente

23 subdivisions indexed

Everything north of Avenida Pico: 1960s-70s beach-adjacent tracts, later suburban infill, two mobile home parks and the newest coastal collections. Extremely broad in age and price.

Coast District

16 subdivisions indexed

A map-defined grouping of coastal-facing and near-coastal tracts of varied era and product. Boundaries here need the most verification of any grouping on the map.

Marblehead

9 subdivisions indexed

Established inland and hillside Marblehead subdivisions, including the gated Highland Light enclaves and a small custom-home component. Distinct from the newer Marblehead Coastal / Sea Summit area.

Forster Ranch

24 subdivisions indexed

Inland canyon and ridgeline tracts built largely from the 1980s onward, from core production housing to the later gated Reserve neighborhoods. Slope and usable yard vary sharply.

Talega

44 subdivisions indexed

The largest grouping by a wide margin. Attached housing, detached production tracts, higher-end enclaves, age-qualified housing and golf-oriented locations under layered association and special-tax structures.

Rancho San Clemente

14 subdivisions indexed

Hillside and ridgeline environment where elevation, orientation and line of sight separate otherwise similar floor plans. Freeway proximity is a real variable on some streets.

Central San Clemente

19 subdivisions indexed

Mixed-era central tracts and attached communities sitting inside the broader Downtown / Del Mar / Pier Bowl environment, which uses different terminology than the map does.

Southeast San Clemente

14 subdivisions indexed

Southern hillsides and attached communities around the municipal golf course and the approach to the Camp Pendleton boundary. Mid-century tract housing through attached cottage condominiums.

Southwest San Clemente

9 subdivisions indexed

The most location-sensitive grouping: coastal housing of widely varied age and design, beach-oriented micro-locations, custom and infill construction and gated coastal enclaves.

Market Area, Community & Subdivision Directory

Every subdivision name indexed from the color-coded map is listed below, filed under its map grouping. Records marked Researching exist as knowledge entries and don't have their own page yet. They'll get one when there's verified research to publish, not before.

North San Clemente

Research In Progress
Show all 23 subdivisions
  • Bay Cliff Village
  • Capistrano Shores MHP
  • Chateau Clemente
  • Colony Cove
  • Harbor Estates
  • La Cuesta Cove
  • Manzana Estates
  • Mira Costa Villas
  • Ocean Hills
  • Pacific Park Mobile Estates
  • San Clemente Terrace
  • Sea Pointe Estates
  • Sea Summit-Aqua
  • Sea Summit-Azure
  • Sea Summit-Indigo
  • Sea Summit-Sapphire
  • Seascape Village
  • Seaview Estates
  • Shore Cliff Villas
  • Shorecliffs
  • Summer Place
  • Sunset Village
  • Vista Pacific Del Gado

Talega

Community Intelligence Published

Talega is a large foothill master-planned community in northeastern San Clemente, with a resale market spread across dozens of named subdivisions layered over a shared master-community framework. The specific tract, builder, product generation, governance obligations, topography, and backing condition often matter a lot more than a Talega-wide median.

Show all 44 subdivisions
  • Alassio
  • Alora
  • Alta
  • Amalfi
  • Cantabria
  • Caprizi
  • Careyes
  • Carillon
  • Bella Vista
  • Carmel
  • Pacifica
  • Verano
  • Catania
  • Cazadero
  • Escala
  • Farralon Ridge
  • Lucia
  • Mirador
  • Miraleste
  • Montellano
  • Monterey
  • Pacifica Summit
  • Portofino
  • Portomarin
  • Ravenna
  • Sabella
  • San Lucar
  • San Rafael
  • Sandbridge
  • Sansol
  • Santalana
  • Seagarden
  • Seaside
  • Solana
  • Stella Mare
  • Terra Linda
  • Trinidad
  • Vittoria
  • Vizcaya
  • Waterleaf
  • Wavecrest
  • Talega Gallery
  • Mendocino at Talega Apartments
  • Pinnacle at Talega Apartments

Coast District

Research In Progress
  • Coral Pointe
  • Eagles Ridge
  • Heights Above the Coast
  • Las Marias
  • Marbrisa
  • Marlborough Seaview
  • Mystic Hill
  • Normandie Ridge
  • Oyster Bay
  • Pavillion Heights
  • Ponderosa Shores
  • Sea Canyon New
  • Sea Canyon Old
  • Sea Coast Estates
  • Shorecliff Mobile Park
  • Vista Del Verde

Marblehead

Research In Progress
  • Crest
  • Faire Harbour
  • Highland Light Estates
  • Highland Light Village
  • Marblehead Custom Homes
  • New Providence
  • Signal Pointe
  • Summit at Highland Light
  • Summit by Zellner

Forster Ranch

Research In Progress
Show all 24 subdivisions
  • Alisal
  • Ashton
  • Cantomar
  • Casablanca
  • Colony at Forster
  • Compass Pointe
  • Del Cabo
  • El Encanto
  • Flora Vista
  • Las Veredas
  • Naples
  • Reserve East
  • Reserve North
  • Reserve South
  • Reserve West
  • Ridgemore
  • Rimrock
  • San Angelo
  • Sunset Ridge
  • Tocayo Canyon
  • Tocayo Hills
  • Tocayo Ridge
  • Veracruz
  • Villamar

Rancho San Clemente

Research In Progress
  • Bella Vista
  • Brisa Del Mar
  • Harbor Ridge
  • Harbor View
  • Mandalay
  • Montego
  • Pacific Crest
  • Pacific Shores
  • Rancho Cristianitos
  • Richmond Pointe
  • Vilamoura
  • Villa Pacifica
  • Villagio
  • Vista Pacifica

Central San Clemente

Research In Progress
  • Barrington
  • Broadmoor
  • Casa Grande
  • Driftwood Bluffs
  • Hillcrest
  • Landmark
  • Los Palizada
  • Marquita
  • Misty Ridge
  • Pacifica
  • Panorama
  • Presidio Point
  • Rancho Margarita
  • Reef Gate West
  • Sunset Shores
  • Villa Granada
  • Villa Grande
  • Villa Hermosa
  • Villa La Paloma

Southeast San Clemente

Research In Progress
  • Cantamar
  • Casa Contenta
  • Palacio Del Mar
  • Patrician
  • Patrician Manor
  • Patrician Villa
  • Pinnacle
  • President Heights I
  • President Heights II
  • Royal Crest Condos
  • Salvador Summit
  • Sea Ridge Estates
  • Seaview Townhomes
  • Sierra Del Mar

Southwest San Clemente

Research In Progress
  • Breakers
  • Cotton Point
  • Cyprus Cove
  • Cyprus Shore
  • Horizon
  • Parkview Manor
  • Riviera District
  • Sea Pointe Villas
  • Villa Montalvo Vista

Housing Product by Era

This is a structural comparison, not a pricing guide. Individual properties vary widely within every era.

EraWhere it concentratesTypical productWhat to examine closely
1920s - 1930sOriginal coastal grid, Pier Bowl, Del Mar vicinitySpanish Colonial Revival originals, small lots, heavily renovated over timeFoundation and framing history, permit record for past renovations, original systems, historic design expectations
1950s - 1970sNorth San Clemente, Central, SoutheastSingle-story and split-level tract housing, early condominiums, larger flat lots in placesOriginal galvanized or copper plumbing, electrical panel capacity, sewer laterals, roof and window replacement history
1980s - 1990sRancho San Clemente, Forster Ranch, MarbleheadTwo-story move-up production housing, hillside and slope lots, planned amenitiesSlope and retaining wall condition, original plumbing, HVAC age, association scope and reserves
2000sTalega, later Forster Ranch enclavesMaster-planned detached and attached product, larger floor plans, layered associationsMaster plus sub-association structure, special tax districts, builder-era construction issues, amenity access rules
2010s - presentSea Summit, coastal infill and rebuildsModern coastal construction and full rebuilds on older lotsPermit and completion record, coastal zone approvals, warranty status, comparability to surrounding older stock

Coastal Micro-Markets

On the coastal side of San Clemente, the distance between two properties matters far less than what sits between them. These are the variables that separate near-identical listings.

Beach access is specific. The city's beach trail and individual access points (North Beach, the Pier, T-Street, Riviera, Calafia) each serve a different set of streets. Whether a home has a short walk, a long walk, or a route that requires crossing the rail corridor is a real distinction a map radius won't show you.

The rail corridor runs through the coastal market. The tracks sit between much of the housing and the sand. Some streets sit well above and away from them, while others sit directly adjacent. Noise, access, and crossing points vary block by block, and they're worth evaluating in person at more than one time of day.

View protection is not automatic. An ocean view can be affected by buildout, mature landscaping, or a neighboring remodel. Whether a specific view is protected depends on the tract, the association documents, and applicable city regulations. It should always be verified, not assumed.

Coastal exposure has maintenance consequences. Proximity to salt air affects exterior finishes, window and door hardware, metal components, and the general maintenance cycle. This is a cost-of-ownership factor, not a defect.
Talega as Its Own Market

Talega is large and varied enough that it's really a market within the market, not just a single neighborhood.

Layered ownership costs

Verify per address

Talega properties can carry a master association, a sub-association for attached or gated neighborhoods, and special tax district obligations. The combination differs by tract and must be confirmed from current documents for the specific property.

Product range is unusually wide

Attached to estate

The same community contains attached condominiums, production detached housing, larger executive product, age-qualified housing and golf-adjacent locations. Cross-tract comparisons are frequently misleading.

Golf adjacency is not one thing

Course frontage

Fairway frontage, course views without frontage, and simple proximity are three different positions with different privacy, ball-strike exposure and maintenance considerations.

Amenity access varies

Read the documents

Which pools, clubs and facilities a given address may use, and under what terms, is set by the governing documents rather than by geography.

Distance to the coast is real

Location tradeoff

Talega buys newer construction, larger floor plans and planned amenities in exchange for a meaningful drive to the beach and downtown. That tradeoff is the central decision for many buyers.

Village naming is dense

44 named subdivisions

Talega's neighborhood names are numerous and easily confused. Confirm the exact recorded tract before drawing comparisons or pulling comps.

Schools

San Clemente addresses are served by Capistrano Unified School District. School assignment is address-specific, subject to boundary changes and open-enrollment rules, and should always be confirmed directly with the district. We provide district locator tools here rather than static assignment lists or rankings, because both go stale quickly and neither is a substitute for direct verification.

No school rankings, test scores or assignment guarantees are published here. Confirm assignment for the exact address, in writing, before it influences a purchase decision.

Carrying Costs Vary Sharply by Tract

San Clemente has neighborhoods with no association at all, and others carrying several stacked obligations. Treating this as a single citywide number is the most common mistake people make when analyzing this market.

The full carrying cost of a specific property can include the base property tax, voter-approved bonds, special tax district obligations where applicable, master association dues, sub-association dues, and Mello-Roos style assessments in the newer master-planned areas. Which of these apply is always a property-level question.

This platform deliberately does not publish dues amounts or tax rates. Those figures change, they differ between neighboring tracts, and a stale number published confidently is worse than no number at all.

For any property under consideration, request the current association budget, reserve study, governing documents and a current tax bill before drawing conclusions about carrying cost.

Construction & Property Diligence

A checklist for asking sharper questions. None of these are defects by default. They're the items that most often differ between two similar San Clemente homes.

  • Plumbing history

    Homes from the 1960s through the early 1990s may retain original supply lines. Ask whether the home has been repiped, when, by whom, and whether it was permitted.

  • Sewer lateral condition

    Older neighborhoods and mature landscaping mean root intrusion and lateral deterioration. A camera inspection is inexpensive relative to the repair.

  • Roof age and material

    Coastal exposure and the local mix of tile, shingle and flat roofing produce very different replacement timelines. Ask for the age, material and any prior repair record.

  • Slope, drainage and retaining walls

    Hillside tracts in Rancho San Clemente, Forster Ranch and Talega involve engineered slopes and walls. Confirm who maintains them and review any geotechnical or drainage history.

  • Coastal exposure and exterior systems

    Salt air accelerates wear on windows, doors, hardware, railings and exterior finishes. Evaluate condition and the expected maintenance cycle rather than appearance alone.

  • Permit record for prior work

    Beach neighborhoods carry decades of remodels, additions and conversions. Unpermitted work affects value, insurability and future resale.

  • Rail corridor and traffic exposure

    Visit at multiple times of day. Train, freeway and arterial noise vary far more than a listing photo can convey.

  • Association documents in full

    Budget, reserve study, CC&Rs, current dues, pending assessments and litigation disclosure. Read them before the contingency expires, not after.

Buyer Intelligence

The recurring tradeoffs buyers in this market actually decide between.

Beach proximity versus house

The central tradeoff

The same budget buys either a smaller, older home near the sand or a newer, larger home inland. Almost every San Clemente search resolves into some version of this decision.

No association versus full amenities

Cost structure

Older coastal neighborhoods often carry no association and no amenities. Master-planned areas carry meaningful monthly cost in exchange for pools, parks, trails and maintained common areas.

View premium versus view risk

Verify protection

Pay for a view only after understanding whether it is protected and what could obstruct it. This is a documents-and-regulation question, not a visual one.

Renovated versus renovatable

Older stock

In beach neighborhoods, the honest comparison is often a finished home at a premium against an original home plus a realistic, permitted renovation budget.

Commute reality

I-5 access

San Clemente is the southern end of Orange County. Freeway access differs by neighborhood, and the practical commute should be tested at actual commute times.

Single-story availability

Limited supply

Single-level housing concentrates in the older tracts and in specific age-qualified and attached communities. It is a genuine supply constraint worth planning a search around.

The Nearest Comp Is Often the Wrong Comp

San Clemente punishes lazy comp selection more than most South County cities.

Two homes 400 feet apart can sit on opposite sides of a ridge, a canyon, an arterial road, or the rail corridor. One may have a protected white water view and the other none. One may carry no association dues and the other a master association plus a special tax obligation. One may be an original 1968 tract home and the other a full rebuild on the same footprint. Distance alone doesn't make properties comparable.

For sellers, this cuts both ways. The strongest positioning in this market is usually specific rather than general: the exact view type, the exact walking distance and route to a named beach access, the exact lot condition, the documented scope of past work, and the actual carrying-cost structure. Those are the variables buyers here evaluate, and they're the ones that hold up under appraisal scrutiny.

San Clemente Market Data

Current MLS-derived market data for San Clemente. These figures reflect recent transactions rather than the permanent structure of the market. Median prices move based on whatever happened to sell in a given window, while the community, tract, and micro-location distinctions covered on this page continue to explain why two similar homes trade differently. Figures are recalculated on a schedule from CRMLS data supplied through SimplyRETS, and property-specific facts should always be verified against the listing.

Snapshot calculated September 8, 2026 at 6:09 AM Pacific (about 3 hours ago). These figures are generated on a schedule, not queried live when the page loads. The MLS feed itself last updated September 8, 2026 at 6:35 AM Pacific.

Market now

Point-in-time inventory at the calculation time above

Active listings

117

Status: Active only

Coming soon

1

Status: ComingSoon

Active under contract

33

Accepting backup offers

Pending

26

Under contract

Median active list price

$2.23M

Sample: 117 active listings

Median active days on market

36 days

MLS days on market, active inventory

Last 30 days

August 9 – September 8, 2026 · closed sales counted by close date

New listings

67

First listed in this window, whatever their status today. 10% more than the prior 30 days (61)

Closed sales

55

8% fewer than the prior 30 days (60)

Median closed price

$1.8M

11% higher than the prior 30 days ($1.63M)

Median closed days on market

18 days

80% longer than the prior 30 days (10 days)

Closed price per sq ft

$808/sq ft

Median of closed price divided by living area

Median Sale-to-Last-List

98%

Median closed price against the final list price. Against the original list price: 97%.

Price & sales trend

Complete calendar months only, September 2025 to August 2026. 625 closed sales in this window.

San Clemente closed sales, monthly count
San Clemente 3-month rolling median closed price(median of all closed sales in the trailing three months, not an average of monthly medians)

The 3-month rolling median closed price through August 2026 is 3% above the same rolling period a year earlier ($1.7M through August 2025), pooling 190 and 163 closed sales respectively.

Market balance

1.8 Months of Inventory

Seller-Leaning Market

Market Activity Index: current available inventory measured against the recent pace of closed sales, expressed as months of inventory.

Activity Index lookback

Current active listings

117

Point-in-time, status Active only

Avg closed / month

63.3

3 complete months · Jun 26 – Aug 26

Months of inventory

1.8

Seller's Market range

117 active listings ÷ 63.3 average monthly closed sales = 1.8 months of inventory. Current inventory is equal to approximately 1.8 months of sales at the recent 3-month closing pace, which falls in the Seller's Market range.

San Clemente monthly closed sales(historical). The horizontal lines mark the 3-month average closing pace and current Active inventory at the latest snapshot, a current count, not a past month.

Filled bars are the months inside the selected lookback. Lighter bars are earlier months shown for context. No month-by-month history of Active inventory has been stored yet, so none is drawn. Past Active inventory is never reconstructed from current listing statuses.

Months of inventory

Under 3 months · 3 to 6 months · over 6 months

1.8 mo
Seller’s Marketunder 3.0Neutral Market3.0 – 6.0Buyer’s Marketover 6.0

For orientation, this platform describes under 3.0 months of inventory as a Seller’s Market, 3.0 to 6.0 months as Neutral and over 6.0 months as a Buyer’s Market. These are market-balance ranges used by this platform; they describe the relationship between current supply and recent sales pace, and are not a recommendation to buy or sell.

Current competition by price band

Active listings only. 117 listings distributed across configured bands. Bar length is relative to the largest band.

  • Under $1M11 · 9%
  • $1M–$1.5M24 · 21%
  • $1.5M–$2M19 · 16%
  • $2M–$3M26 · 22%
  • $3M–$5M27 · 23%
  • $5M+10 · 9%
How these numbers are calculated

Source: CRMLS data via SimplyRETS. Market metrics are calculated from listings returned by the configured geographic query. Figures may change as MLS records are updated. Property-specific facts should be independently verified.

Geographic and property query: city in [San Clemente] AND types included [Residential, Condominium, Townhome]; excluded [Rental, Commercial, CommercialLease, Land, Farm, Multi-Family]. Methodology version v2.

  • Only residential for-sale property is counted. Rentals, commercial, land, farm and multi-family income records returned by the same geographic query are excluded before any figure is calculated.
  • Most recent retrieval: 203 records returned, 26 excluded as outside the residential for-sale universe, 0 excluded as outside the mapped area, 177 counted.
  • Active Listings: MLS status Active. Homes actively on the market. Excludes homes under contract, pending, or coming soon.
  • Coming Soon: MLS status ComingSoon. Listings publicly announced but not yet showing as active in the MLS.
  • Active Under Contract: MLS status ActiveUnderContract. Under contract while still accepting backup offers.
  • Pending: MLS status Pending. Under contract, no longer accepting offers through the MLS.
  • Closed Sales: MLS status Closed. Recorded closed transactions, grouped by close date.
  • New listings count homes first listed inside the window, whatever status they hold now, so a home that listed and went pending in the same window is still counted as new.
  • Monthly history uses complete calendar months only. The month in progress is never charted, because a partial month reads as a collapse in sales.
  • Medians and ratios are suppressed below 5 qualifying observations rather than published from a small sample.
  • Sale-to-last-list divides close price by the final list price. Sale-to-original-list uses the original list price where the feed populates it. Both are shown to the nearest whole percent, which is the honest resolution for a median over this many sales.
  • Price per square foot divides close price by MLS living area; listings without living area are excluded.
  • Months of inventory: current Active listings divided by average monthly closed sales, using the trailing 3 complete calendar months by default, with 6- and 12-month lookbacks offered only where that many complete, consecutive calendar months are stored. For orientation, this platform describes under 3.0 months of inventory as a Seller’s Market, 3.0 to 6.0 months as Neutral and over 6.0 months as a Buyer’s Market; these are market-balance ranges used by this platform, not a universal standard. It is also discussed elsewhere as months of supply or absorption; the figure shown here is months of inventory. Every calendar month in the window counts in the denominator, including verified zero-sale months. Both sides of the division come from the same residential-for-sale universe as every other number in this section, and the figure is withheld rather than published when a required calendar month is missing, the closed sample in the lookback is below the suppression threshold or the closing pace is zero.
  • The Market Activity Index chart draws historical monthly closed sales and current Active inventory at the latest snapshot as separate facts. No month-by-month history of Active inventory has been stored for this market yet, so none is drawn: past inventory levels are never reconstructed from current listing statuses.
  • Price charts use a 3-month rolling median of the pooled closed transactions, and the year-over-year figure quotes that same rolling median. Closed counts are monthly and unsmoothed.
  • Property tax figures are never derived from the MLS feed; the field is unpopulated in this feed. School, HOA and assessment facts come from the durable research on this page, not from listing data.
  • Snapshots are generated on a schedule rather than on page load, so figures reflect the calculation time shown above rather than a live query.
  • Listing change tracking began September 3, 2026. Price-reduction metrics appear only once a full tracking window exists.

Where We Are Going Deeper

This page is V1, a verified geographic and structural scaffold. Here's the work queued up next, in priority order.

Market-area boundary verification

In progress

Confirming the practical boundaries of the Coast District and Central San Clemente groupings, and reconciling map terminology with the terminology used in daily practice.

Priority tract build-out

Next

Full pages for the highest-transaction tracts across Talega, Forster Ranch, Rancho San Clemente and the coastal neighborhoods, beginning with the ones buyers ask about most.

Builder and floor plan records

Queued

Original builder, construction years, plan names, square footage ranges and configuration for the production-built tracts.

Association and special tax structure

Queued

Which associations govern which tracts, how master and sub-associations stack, and where special tax districts apply — recorded as structure, with amounts left to per-property verification.

Coastal access and view mapping

Queued

Documenting beach access points, walking routes, rail crossings and view corridors at the street level rather than the neighborhood level.

Market snapshots

Queued

Periodic MLS-derived structural data by market area, published with explicit dates and treated as dynamic rather than durable knowledge.

Verification

What this page is. A geographic and structural breakdown of San Clemente, built from a color-coded subdivision map and research review, then filtered down to what can be stated responsibly today.

What was deliberately withheld. Specific HOA dues amounts, tax and special-assessment rates, school assignments and rankings, price and value figures, crime statistics, specific builder attributions that couldn't be confirmed, and precise boundary lines for groupings still under verification. Each of these is address-specific, time-sensitive, or unconfirmed. Publishing them with false confidence would undermine the rest of the work.

How subdivision names were sourced. Subdivision names are indexed from the color-coded map shown above. They're recorded as knowledge entries at Researching status. A named record on this page isn't a claim that the neighborhood has been individually researched. It simply means the name exists on the map and is now being tracked.

Terminology conflicts are preserved, not resolved. Where local usage and the map disagree (such as Marblehead versus Marblehead Coastal, or map groupings versus Southwest San Clemente, the Pier Bowl, T-Street, and Riviera), both are recorded and the relationship between them is noted.

Nothing here substitutes for property-level due diligence. Verify association documents, tax obligations, school assignments, permit history, and physical condition for the specific address before acting.

Names that overlap the map, but are not subdivisions

Local Market Terminology

Buyers, sellers and agents use area names that do not match recorded subdivision boundaries. Rather than force them into the map hierarchy, this platform records them separately and notes what they overlap.

  • Southwest San Clemente (Local Market Term)

    Southwest · SW San Clemente

  • Downtown / Avenida Del Mar

    The Village · Del Mar

  • Pier Bowl

    The Pier Bowl

  • North Beach

    N. Beach

  • Shorecliffs (Local Market Term)

    Shore Cliffs

  • Sea Summit / Marblehead Coastal

    Marblehead Coastal · Sea Summit

  • T-Street

    Trafalgar · T Street

  • Riviera

    Riviera District

Sources & Verification

Durable review
September 1, 2026
Dynamic data
September 8, 2026
Research status
City Intelligence Published