Source: CRMLS data via SimplyRETS. Market metrics are calculated from listings returned by the configured geographic query. Figures may change as MLS records are updated. Property-specific facts should be independently verified.
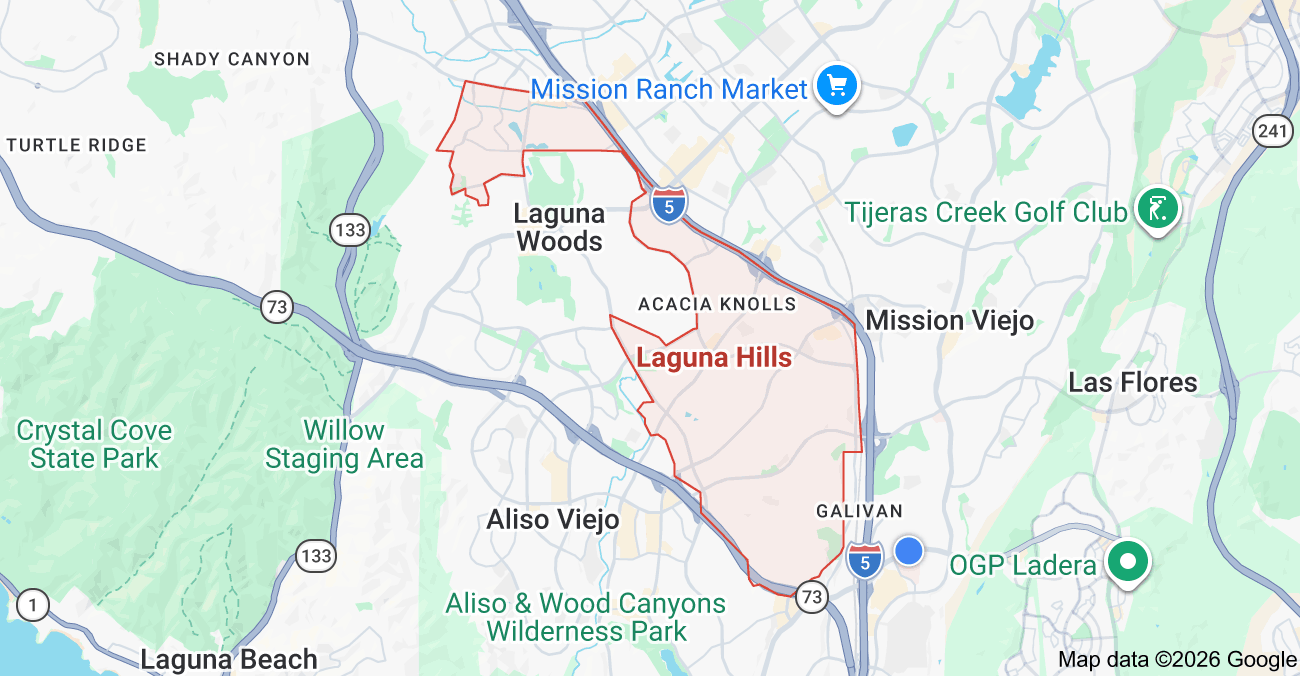
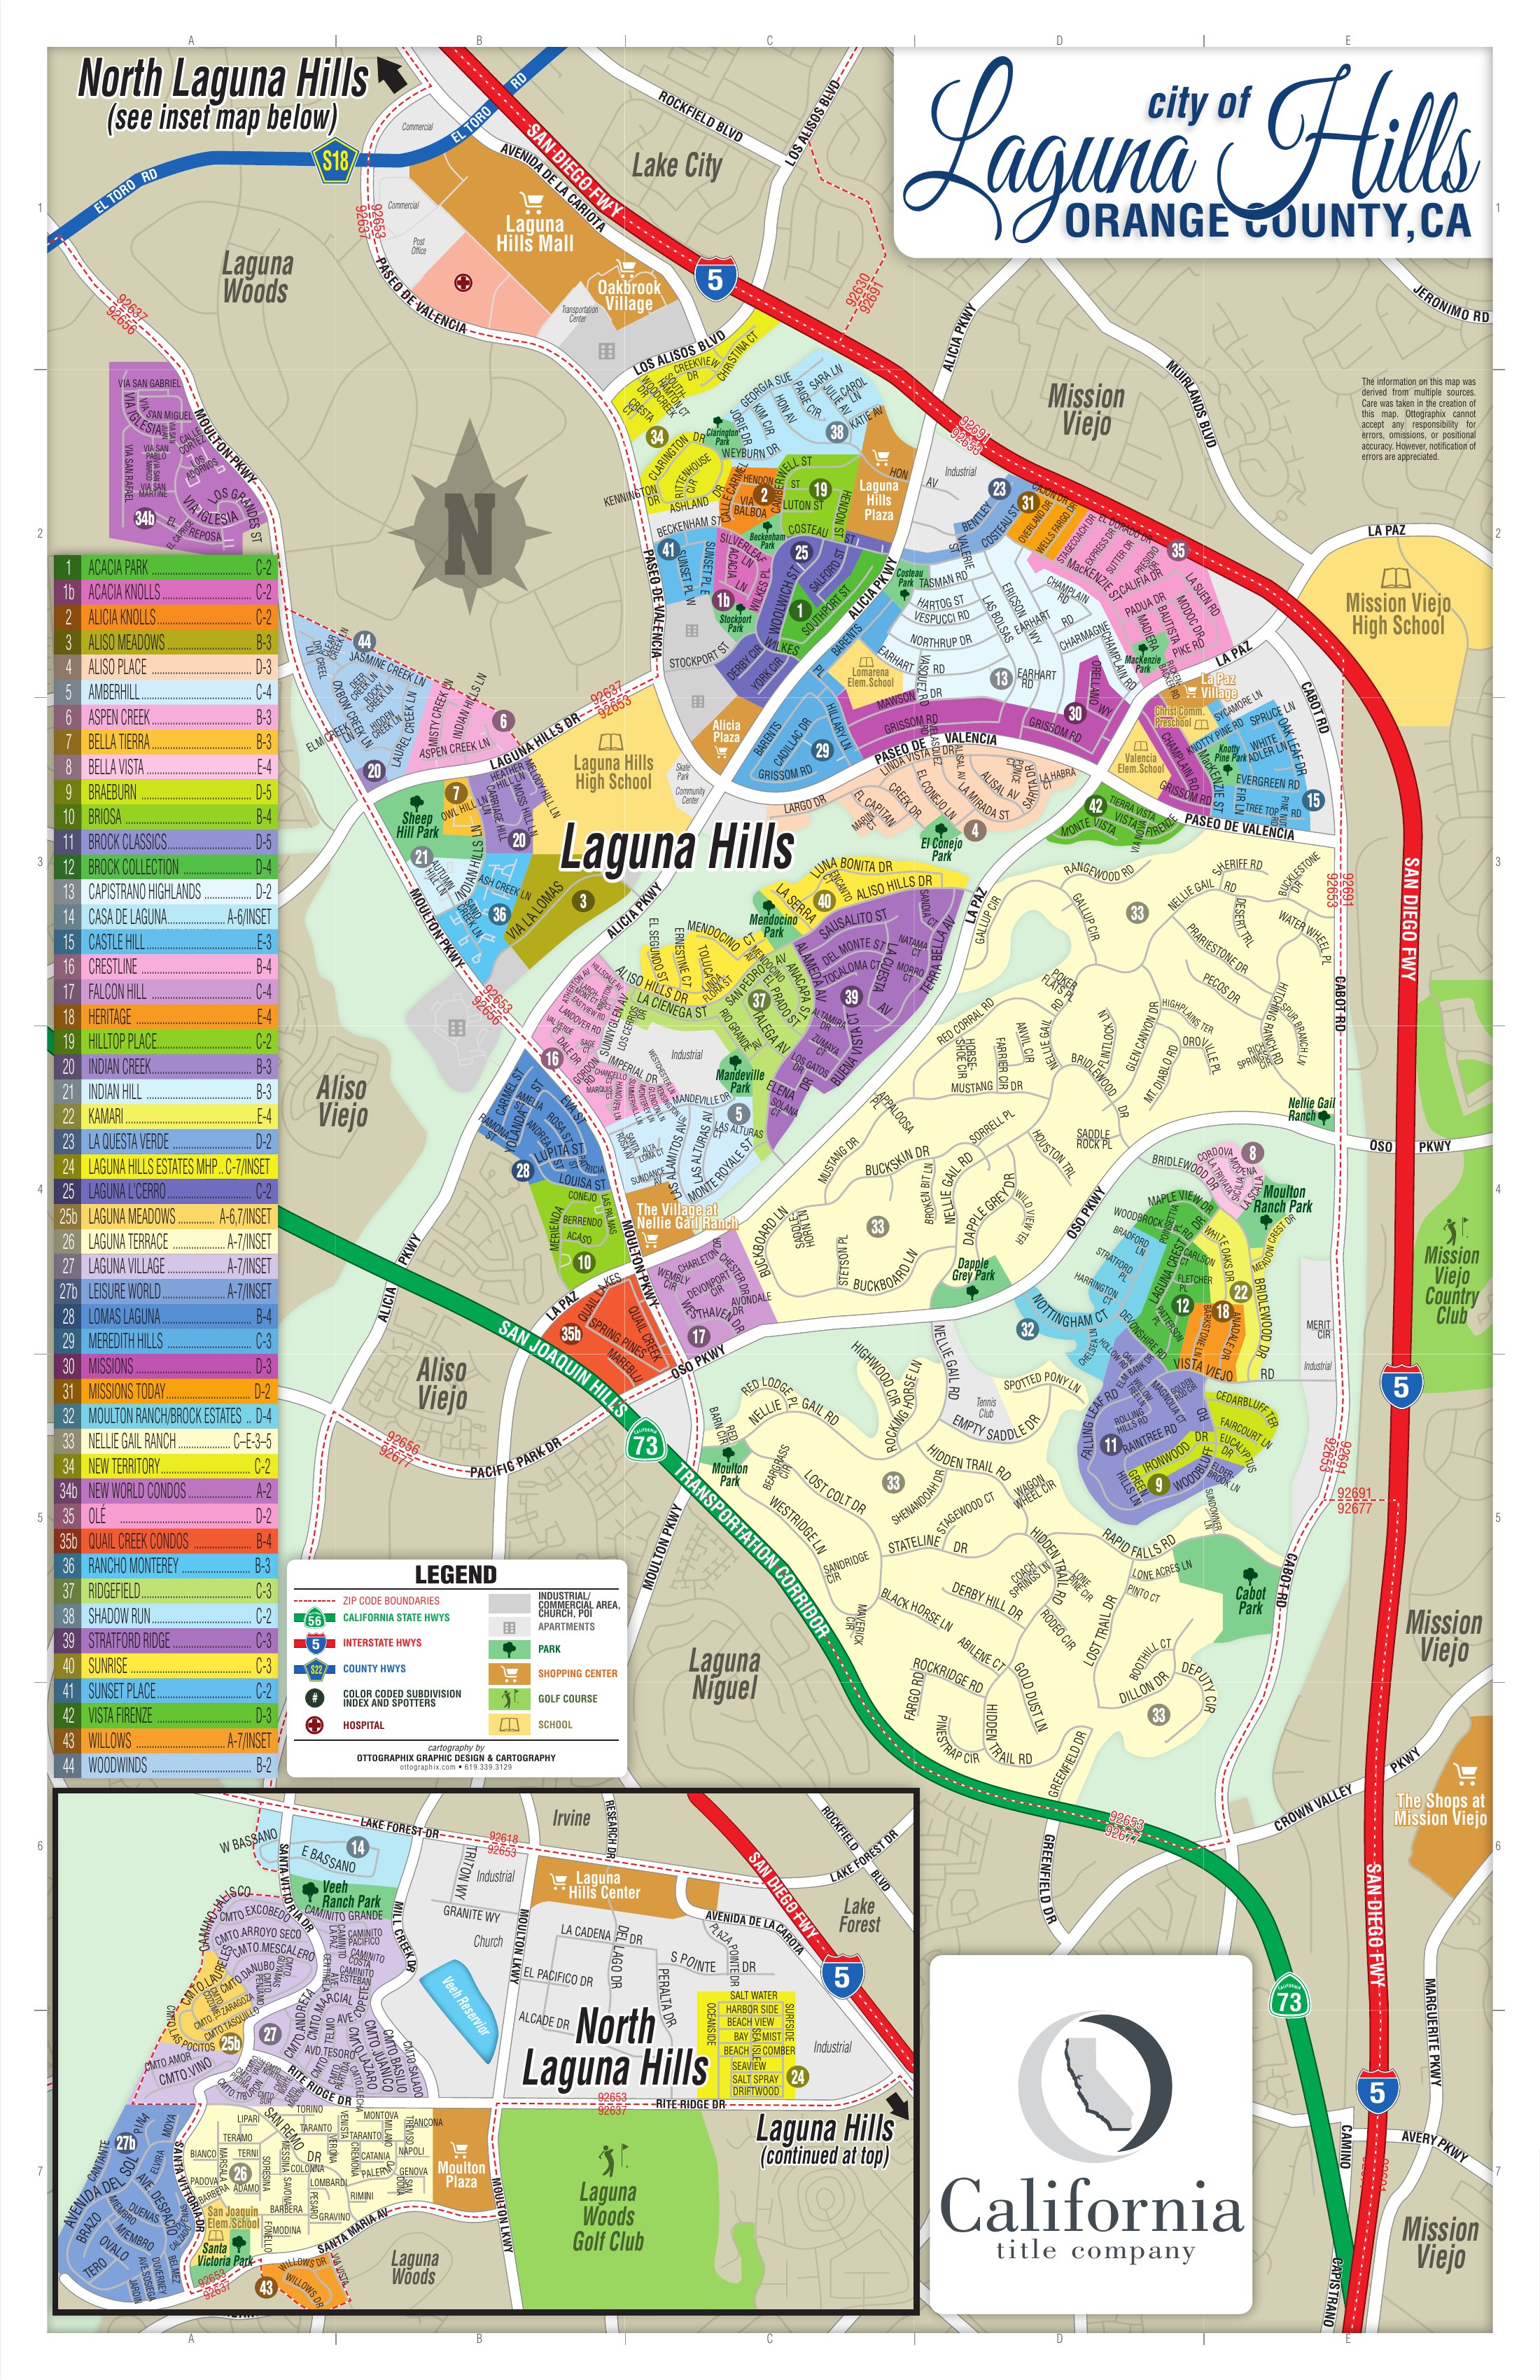
Geographic and property query: city in [Laguna Hills] AND types included [Residential, Condominium, Townhome]; excluded [Rental, Commercial, CommercialLease, Land, Farm, Multi-Family]. Methodology version v2.
- Only residential for-sale property is counted. Rentals, commercial, land, farm and multi-family income records returned by the same geographic query are excluded before any figure is calculated.
- Most recent retrieval: 90 records returned, 11 excluded as outside the residential for-sale universe, 0 excluded as outside the mapped area, 79 counted.
- Active Listings: MLS status Active. Homes actively on the market. Excludes homes under contract, pending, or coming soon.
- Coming Soon: MLS status ComingSoon. Listings publicly announced but not yet showing as active in the MLS.
- Active Under Contract: MLS status ActiveUnderContract. Under contract while still accepting backup offers.
- Pending: MLS status Pending. Under contract, no longer accepting offers through the MLS.
- Closed Sales: MLS status Closed. Recorded closed transactions, grouped by close date.
- New listings count homes first listed inside the window, whatever status they hold now, so a home that listed and went pending in the same window is still counted as new.
- Monthly history uses complete calendar months only. The month in progress is never charted, because a partial month reads as a collapse in sales.
- Medians and ratios are suppressed below 5 qualifying observations rather than published from a small sample.
- Sale-to-last-list divides close price by the final list price. Sale-to-original-list uses the original list price where the feed populates it. Both are shown to the nearest whole percent, which is the honest resolution for a median over this many sales.
- Price per square foot divides close price by MLS living area; listings without living area are excluded.
- Months of inventory: current Active listings divided by average monthly closed sales, using the trailing 3 complete calendar months by default, with 6- and 12-month lookbacks offered only where that many complete, consecutive calendar months are stored. For orientation, this platform describes under 3.0 months of inventory as a Seller’s Market, 3.0 to 6.0 months as Neutral and over 6.0 months as a Buyer’s Market; these are market-balance ranges used by this platform, not a universal standard. It is also discussed elsewhere as months of supply or absorption; the figure shown here is months of inventory. Every calendar month in the window counts in the denominator, including verified zero-sale months. Both sides of the division come from the same residential-for-sale universe as every other number in this section, and the figure is withheld rather than published when a required calendar month is missing, the closed sample in the lookback is below the suppression threshold or the closing pace is zero.
- The Market Activity Index chart draws historical monthly closed sales and current Active inventory at the latest snapshot as separate facts. No month-by-month history of Active inventory has been stored for this market yet, so none is drawn: past inventory levels are never reconstructed from current listing statuses.
- Price charts use a 3-month rolling median of the pooled closed transactions, and the year-over-year figure quotes that same rolling median. Closed counts are monthly and unsmoothed.
- Property tax figures are never derived from the MLS feed; the field is unpopulated in this feed. School, HOA and assessment facts come from the durable research on this page, not from listing data.
- Snapshots are generated on a schedule rather than on page load, so figures reflect the calculation time shown above rather than a live query.
- Listing change tracking began September 3, 2026. Price-reduction metrics appear only once a full tracking window exists.